
Interface Overview: Four-zone Layout
All docs › Quick Start › Interface Overview: Four-zone Layout
Overview of the four main areas
The DIGspace Desktop client uses the classic four-zone layout of professional software, with a clear interface and well-defined functional areas. Understanding the four-zone layout is the first step to mastering the software.
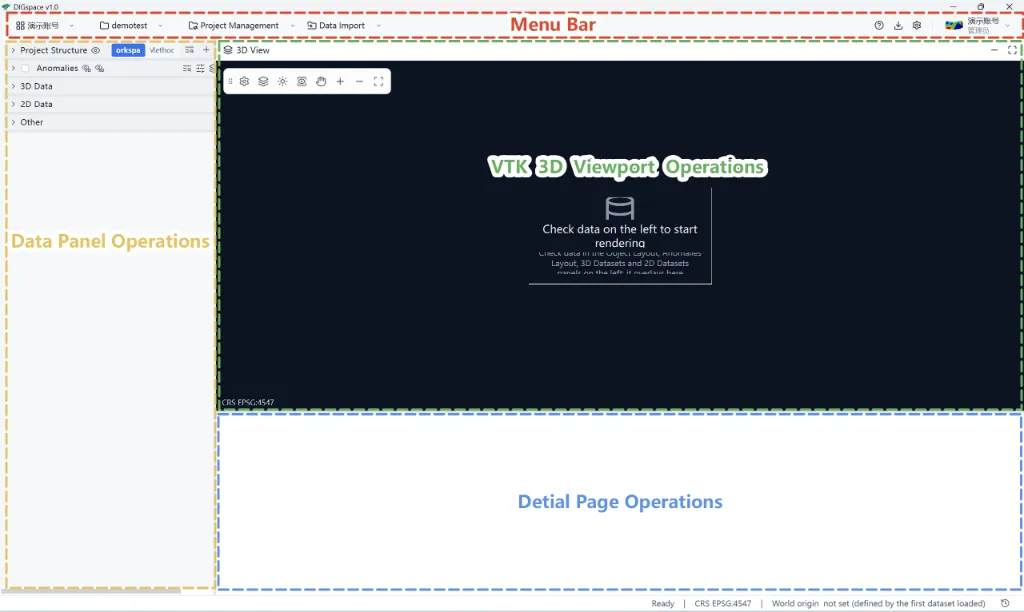 Fig 1
Fig 1| Area | Location | Summary | Detailed documentation |
|---|---|---|---|
| Menu bar | Top | Global function navigation; entry for all cross-method operations | Top Menu Bar |
| Data panel | Left area | Data-management hub, data organization and retrieval | Left Data Panel Operations |
| 3D Viewport | Top-right main area | 3D rendering display area, the main place for spatial observation | VTK 3D Viewport Operations |
| Detail Page | Bottom-right area | Single-data in-depth analysis workbench | Detail Page Operations Overview |
Top Menu Bar
The top menu bar is at the very top of the interface, arranged horizontally with 7 entries from left to right: Tenant Space Switching, Project Name & Operations, Project Management, Data Import, Help, Settings, and User Account.
The menu bar carries all global- and project-level feature entries and is the first gateway into each function.
TipDesign principle: global capabilities go to the menu bar, in-method functions go to the detail page. When you can't find a feature, first decide whether it's a global or single-data operation.
Left data panel
The left data panel is the data-management hub. All imported project data is displayed by spatial attribute and divided top-down into five logical zones: Project Structure, Anomaly List, 3D Data, 2D Data, and Other.
The data panel's core interaction logic: check to control visibility, select to adjust, right-click to find features.
VTK 3D Viewport
- The VTK 3D viewport is located in the main area at the top right and is the final display place for all spatial data. 3D data, 2D data, anomalies and base maps are all rendered overlaid in this viewport.
- Core operations:Left-click rotate, right-click pan, wheel zoom, space to focus. The toolbar provides 8 auxiliary functions.
Detail Page
The detail page is at the bottom-right and is the deep-analysis workbench for a single data item. Detail pages of different methods vary in layout but all follow the four-zone skeleton of 'top toolbar + left tools + center view + right properties'.
The detail page supports multi-tab coexistence, opening multiple data items simultaneously for comparison analysis.
Operation tips
- Double-click to open the detail page:Besides anomalies, double-click any sub-data to quickly open the detail page.
- Check to control show/hide:Check it in the data panel and the data appears in the 3D viewport.
- Right-click to find features:When you can't find an operation, try the right-click menu first.
- Menu divided into global/method:Global operations are in the menu bar; single-data operations go to the detail page.