
DIGspace Platform
From exploration data to spatial insight
DIGspace is a 3D geospatial digital platform for engineering investigation and underground-space development: ERT, GPR, boreholes, terrain and imagery converge in one 3D space across edge, web, mobile and desktop — making subsurface structures visible, anomalies explainable, and change trackable.
- Connect multi-source data
- Underground space, understood
- Support engineering decisions
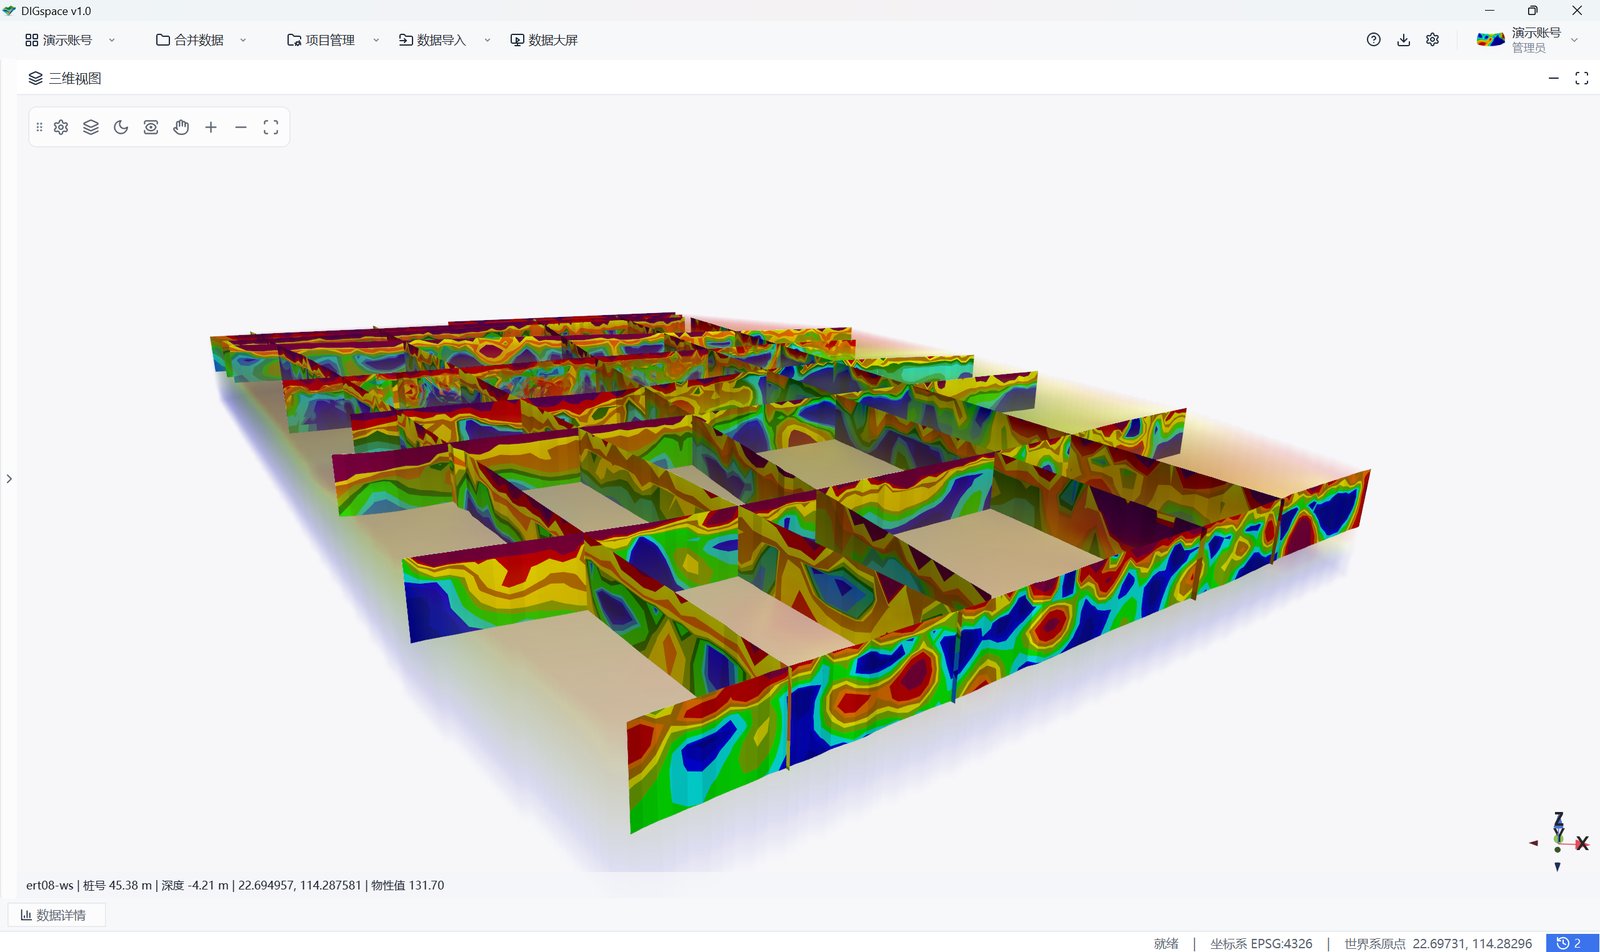
First we solve the data problem: it cannot get in — and it will not line up
The platform's first layer of value is not algorithms — it is bringing data scattered across devices, software and disciplines into one space.
- Geophysics · ERT inversion volumes / GPR sections / electrode arrays / apparent resistivity
- Borehole logs · CSV import / stratigraphic columns / sampling records / lithology descriptions
- Remote-sensing surface · satellite imagery / orthophoto / oblique photography / DEM terrain
- Engineering drawings · Shapefile / DXF / GeoJSON / coordinate registration
- Monitoring time series · ERT & microtremor / GNSS displacement / water level & rainfall / alert records
Once data enters the platform it is unified into one coordinate system and one 3D scene — surface imagery and terrain and underground inversion volumes aretwo layers in a single space, not two maps someone has to align by eye.
Acquisition parameters, processing chains and interpretation steps are logged end to end; three months later, you can still trace exactly how a figure was produced.
Turning data into a space that answers questions
In practice, engineering comes down to four questions. 3D analysis gives each one an evidence base you can stand behind.
Where is it?
Planar position and extent of anomalies, down to coordinates
How deep?
Top and base burial depths and thickness — ready to guide excavation and design
What is it?
Property-based conversion plus borehole ground truth to determine its nature
Is it changing?
Monitoring data ingested as time series; threshold alerts surface change early
Six ways to look underground
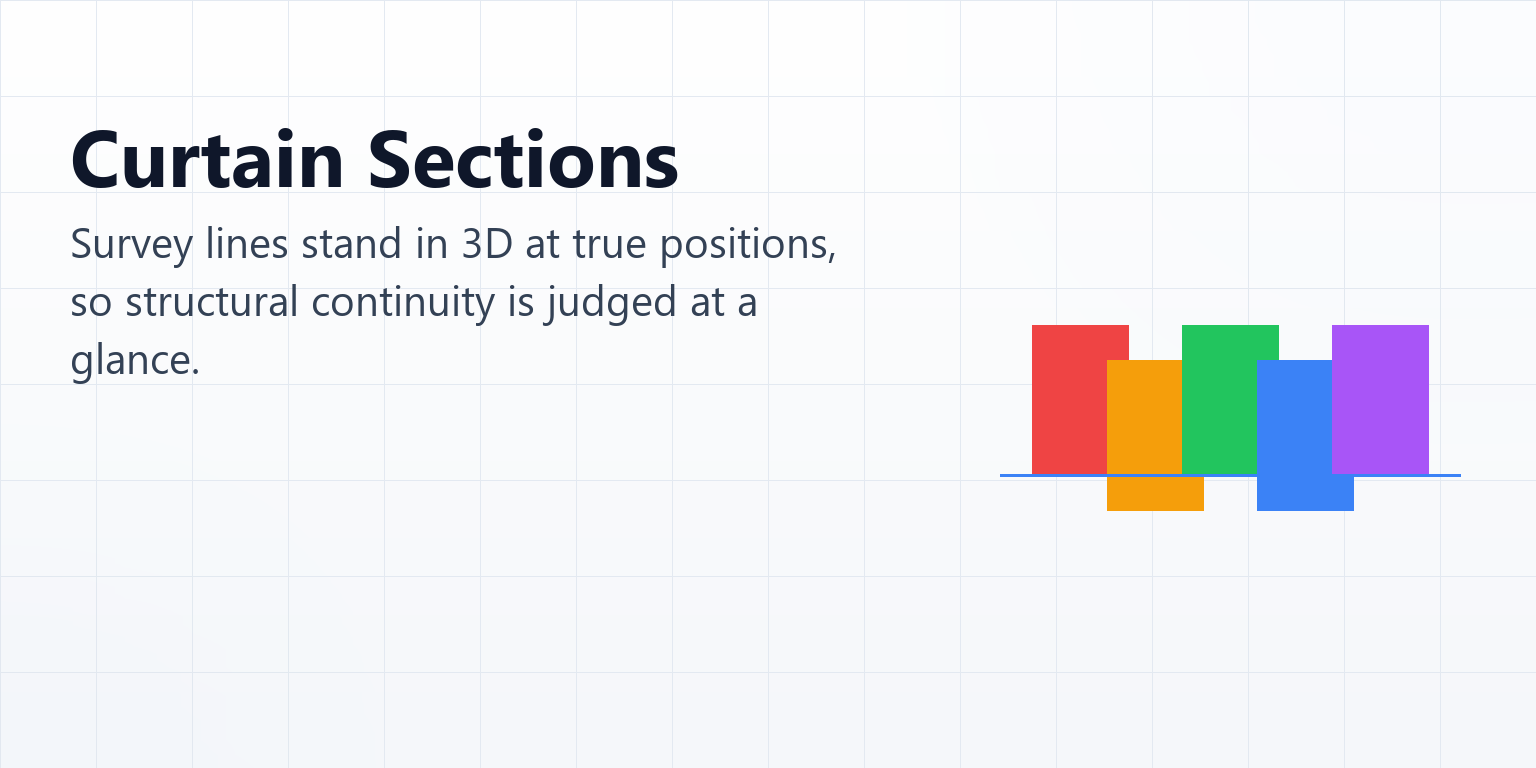
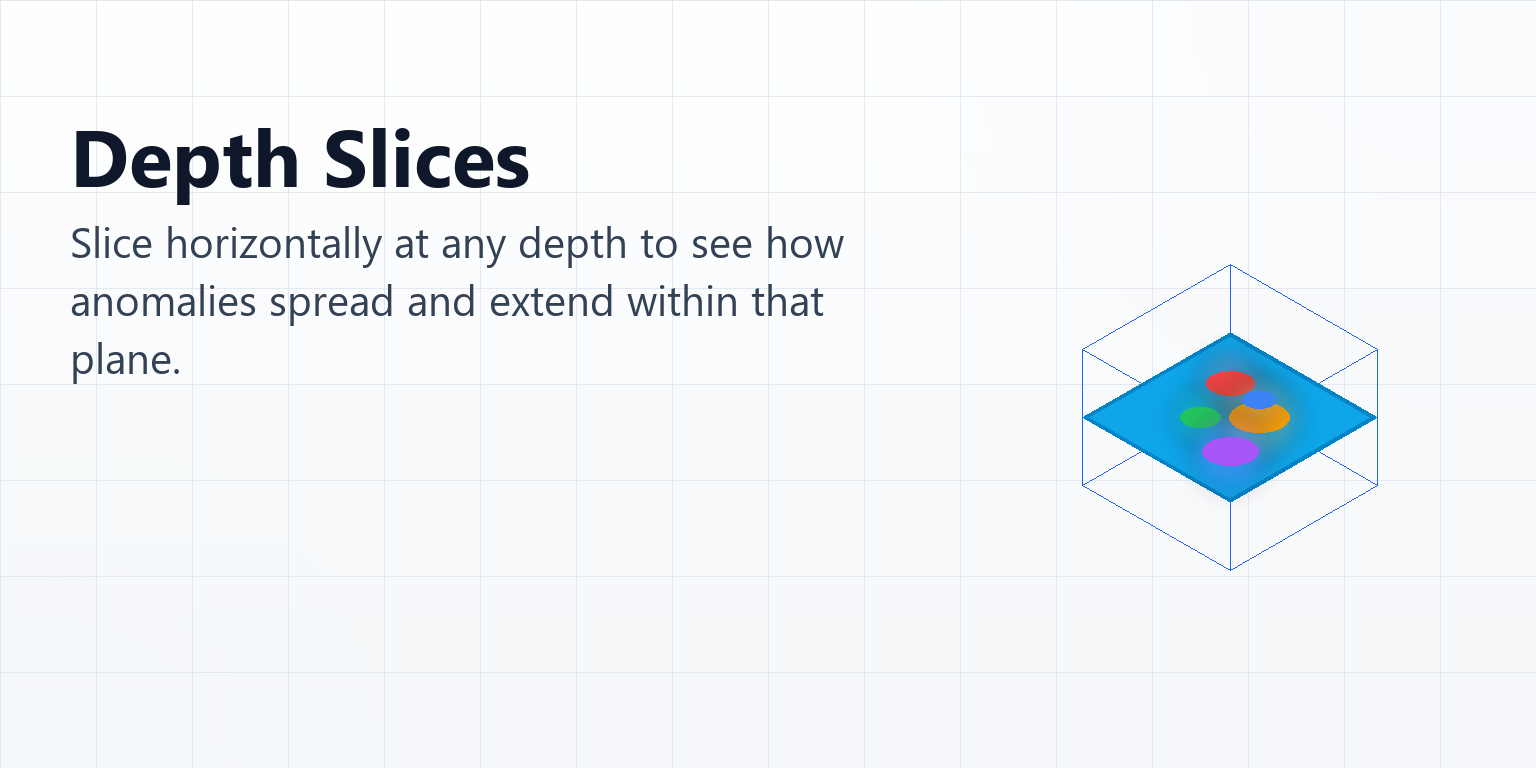
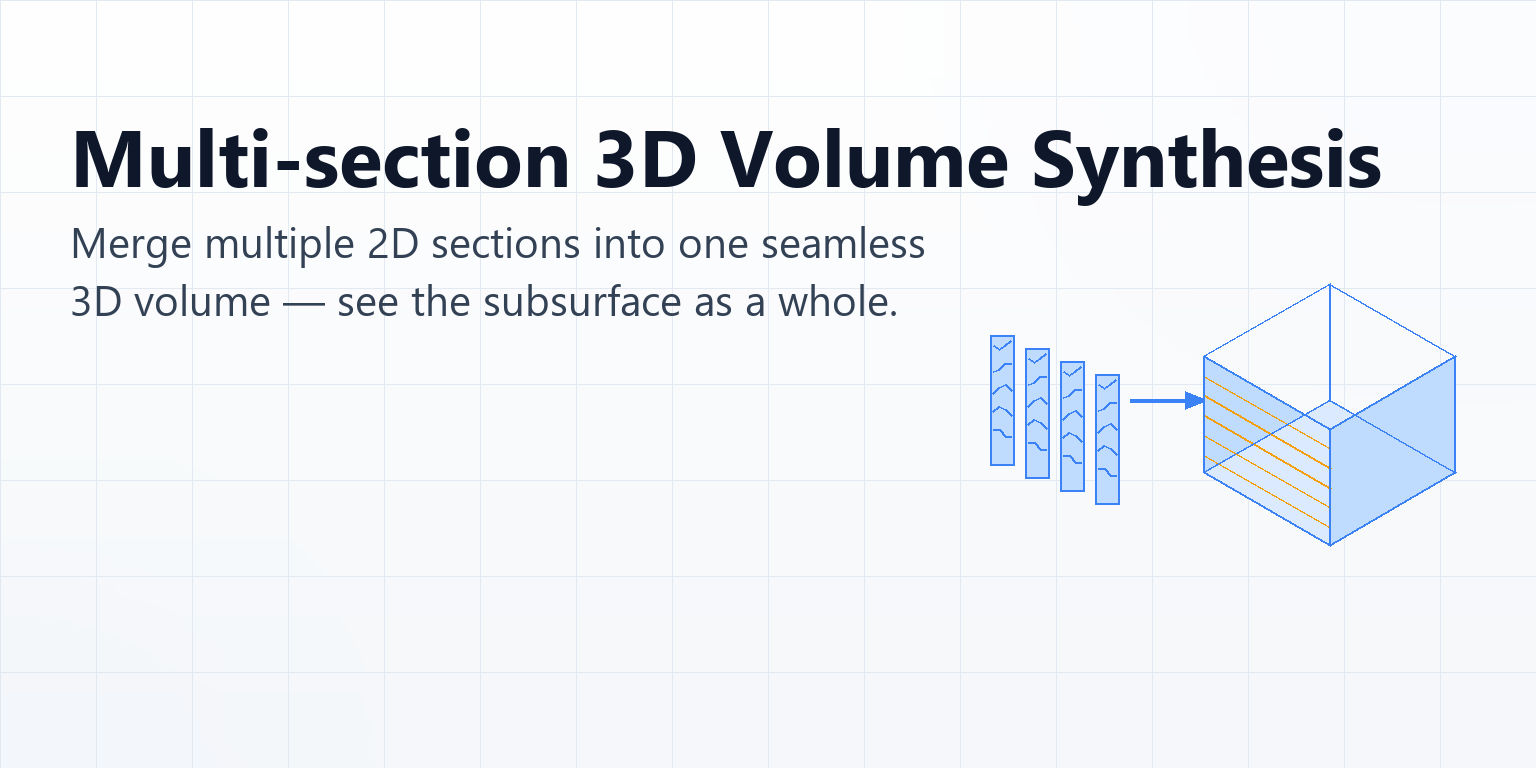
Real-time rendering on the VTK engine lets one data volume be examined again and again from six perspectives.
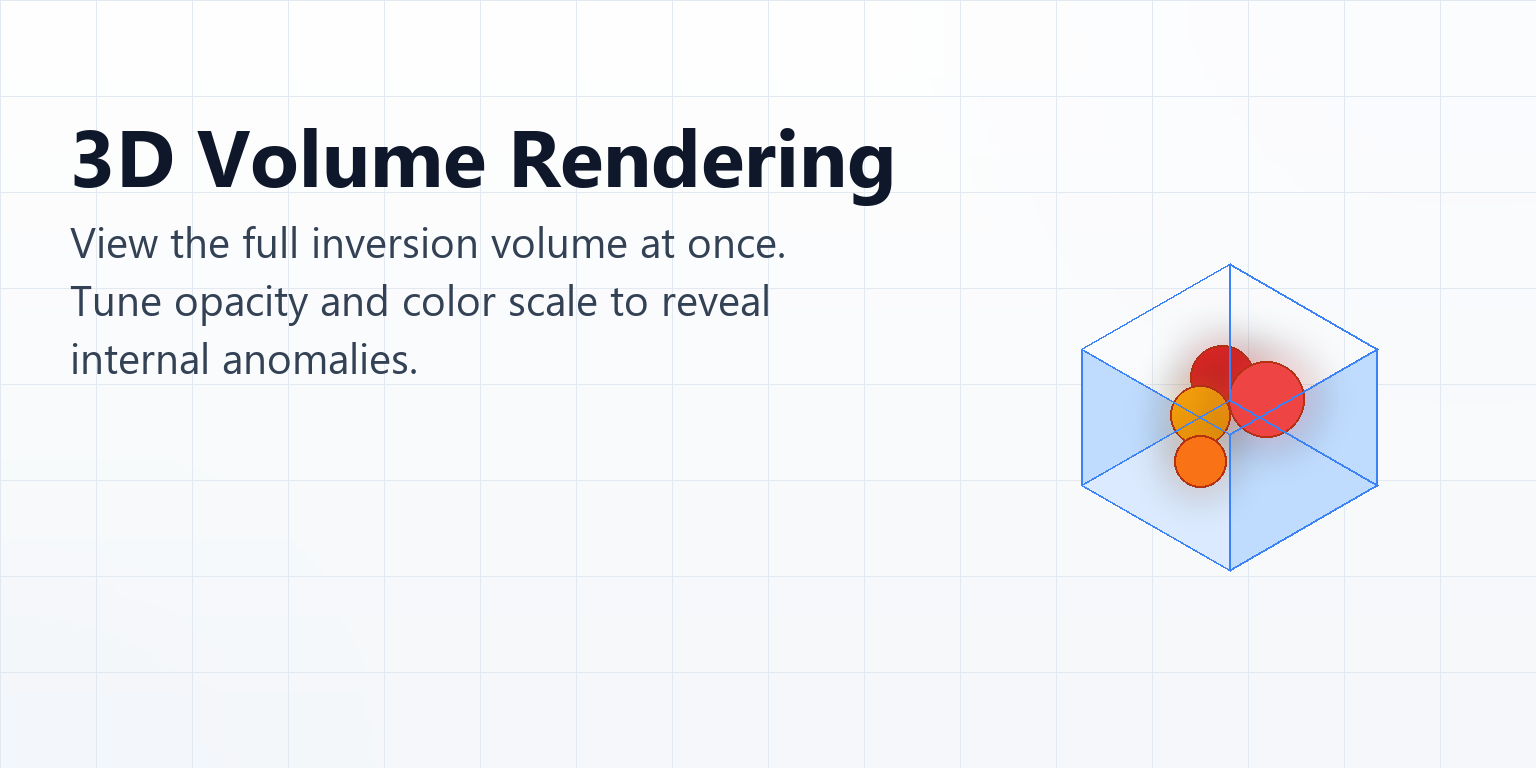
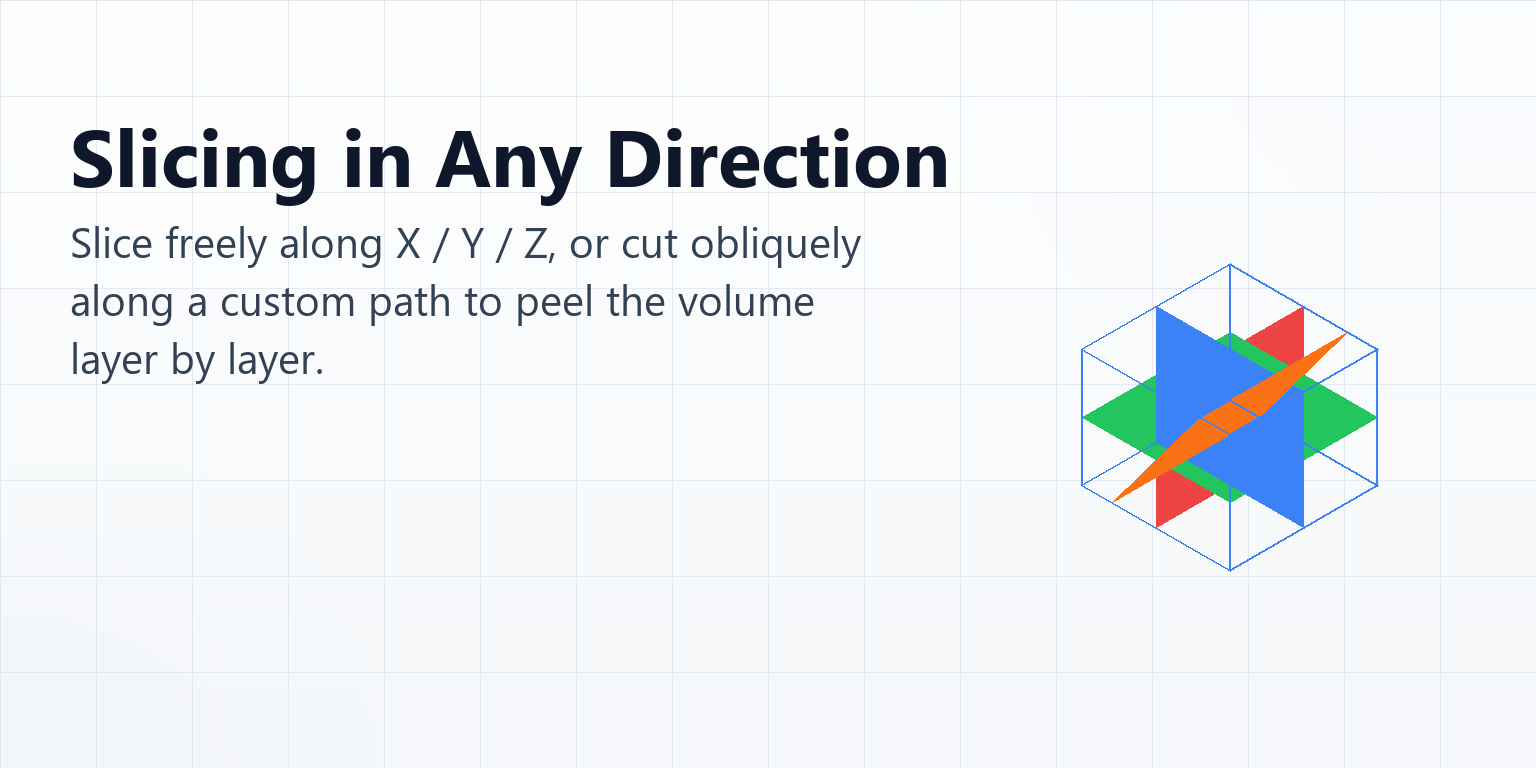
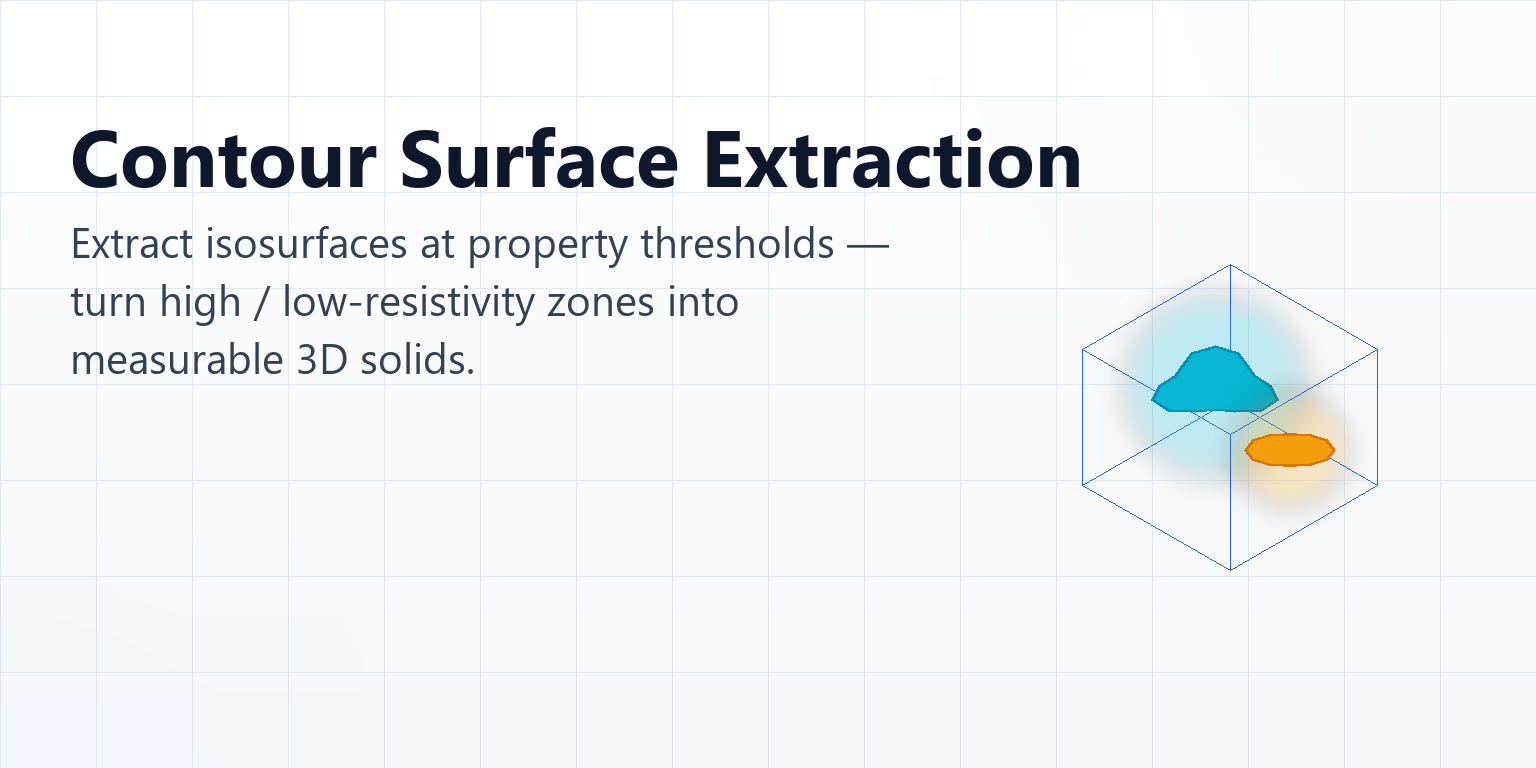
One main line, from raw data to delivered results
Every step is completed inside one platform — no loose intermediate files, no hand-carrying data across software packages.
- 1ImportDirect device connection · multi-format parsing
- 2QCContact resistance · scatter points · GPS tracks
- 3ProcessingInversion computing · processing-chain composition
- 4AnalysisMulti-method joint analysis · cross-validation
- 5VisualizationVolume rendering · slicing · isosurfaces
- 6InterpretAnomaly delineation · classified tagging
- 7ReportOne-click engineering reports · drawings
Store · analyze · report · integrate — a progressive value chain
The four themes are not parallel topics — store is the foundation, analyze is the core, report is the output, integrate is the future.
- 🗄️Integrated data storageKeep data: from scattered files to project assets
- 🔬Integrated multi-method analysisMake data tell the truth: cross-validation reduces ambiguity
- 📄Standardized report outputMake data understood: from images to engineering language
- 🌐Multi-source data fusionLet data foresee the future: from multi-method to multi-source
Methods are the entry point; the platform is the foundation
A method is not just "being able to open data" — it is a complete loop of import → processing → interpretation → 3D deliverables. Results from different methods land in the same 3D scene, so they can be interpreted together.
Methods are the entry point; the platform is the foundation
| Method | Questions it answers | Key capabilities | Status |
|---|---|---|---|
| ⚡Electrical Resistivity Tomography (ERT) | Deep groundwater, seepage paths, fracture zones — deep penetration that shows "where the water is" | Direct GD-10 / GD-20 device connection · 8 data formats · proprietary online inversion engine · 3D volume building · property conversion · First method available for online monitoring | Available in V1.0 |
| 📡 Ground Penetrating Radar (GPR) | Shallow voids, utilities, archaeological remains, pavement distress — high resolution that shows "where the boundaries are" | 8 mainstream radar formats imported natively · 20+ processing nodes freely combined · GPS track QC · depth slices / fence diagrams / volume rendering | Available in V1.0 |
| 🕳️Borehole data | Ground-truth calibration for geophysical interpretation — settling "what it really is" | Fast CSV catalog import · borehole lithology columns compared with ERT / GPR sections in the same scene · ingested as auxiliary data | Supporting data |
| 🔜More geophysical methods: microtremor / TEM / electromagnetics / … | Continually added per industry needs, combining deep and shallow coverage for more engineering scenarios | The data foundation is designed for multiple methods; new methods attach as plugins / modules without changing existing results | Future releases |
Any single method is non-unique; combination is where the platform earns its value
ERT adds depth, GPR adds resolution, boreholes provide ground truth — cross-validation across two or more physical fields is what supports a confident conclusion.
ERT + GPR
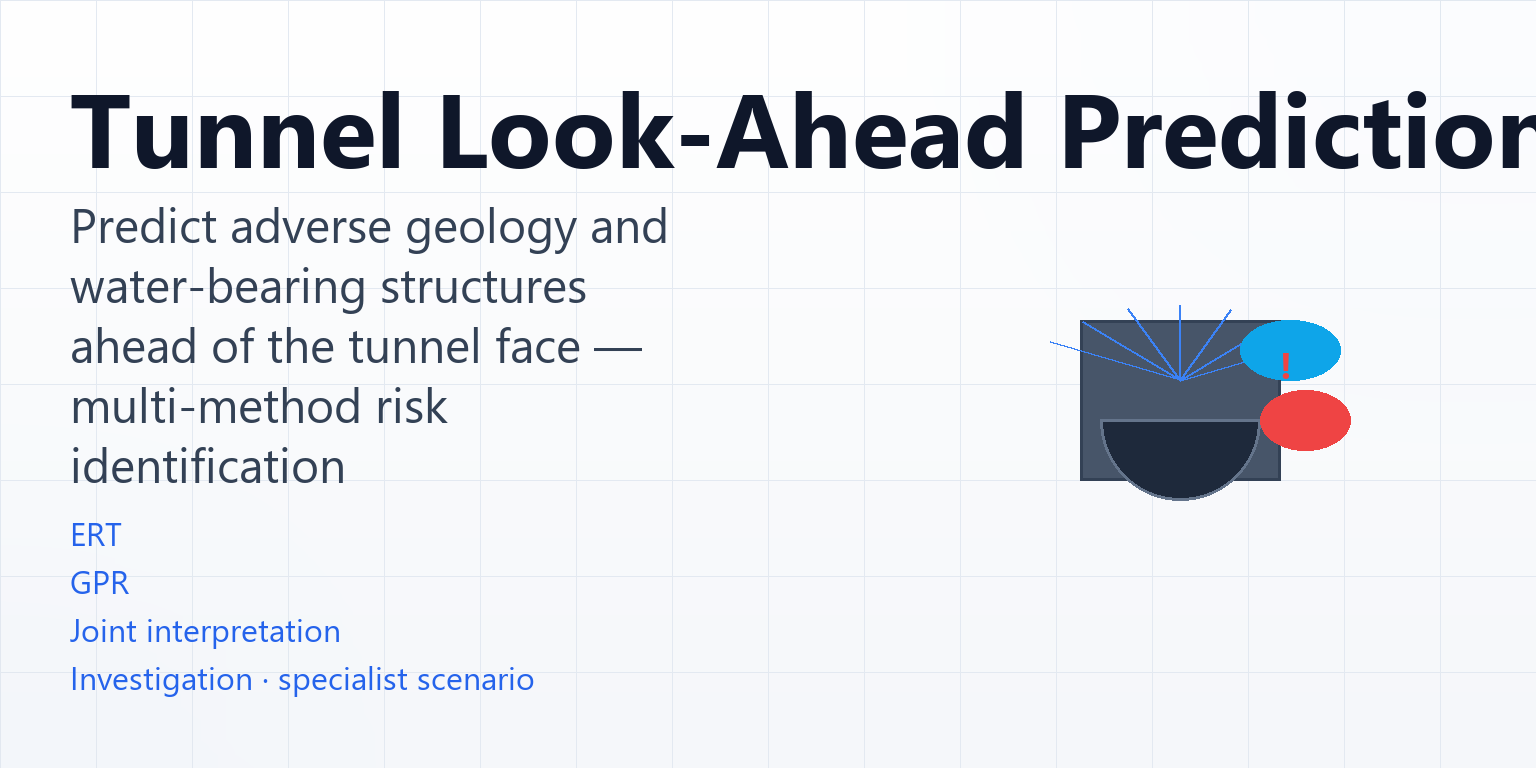
Depth and resolution complement each other · ERT defines extent at depth, GPR defines boundaries near surface Karst cavities · tunnel look-ahead geological prediction
ERT + boreholes
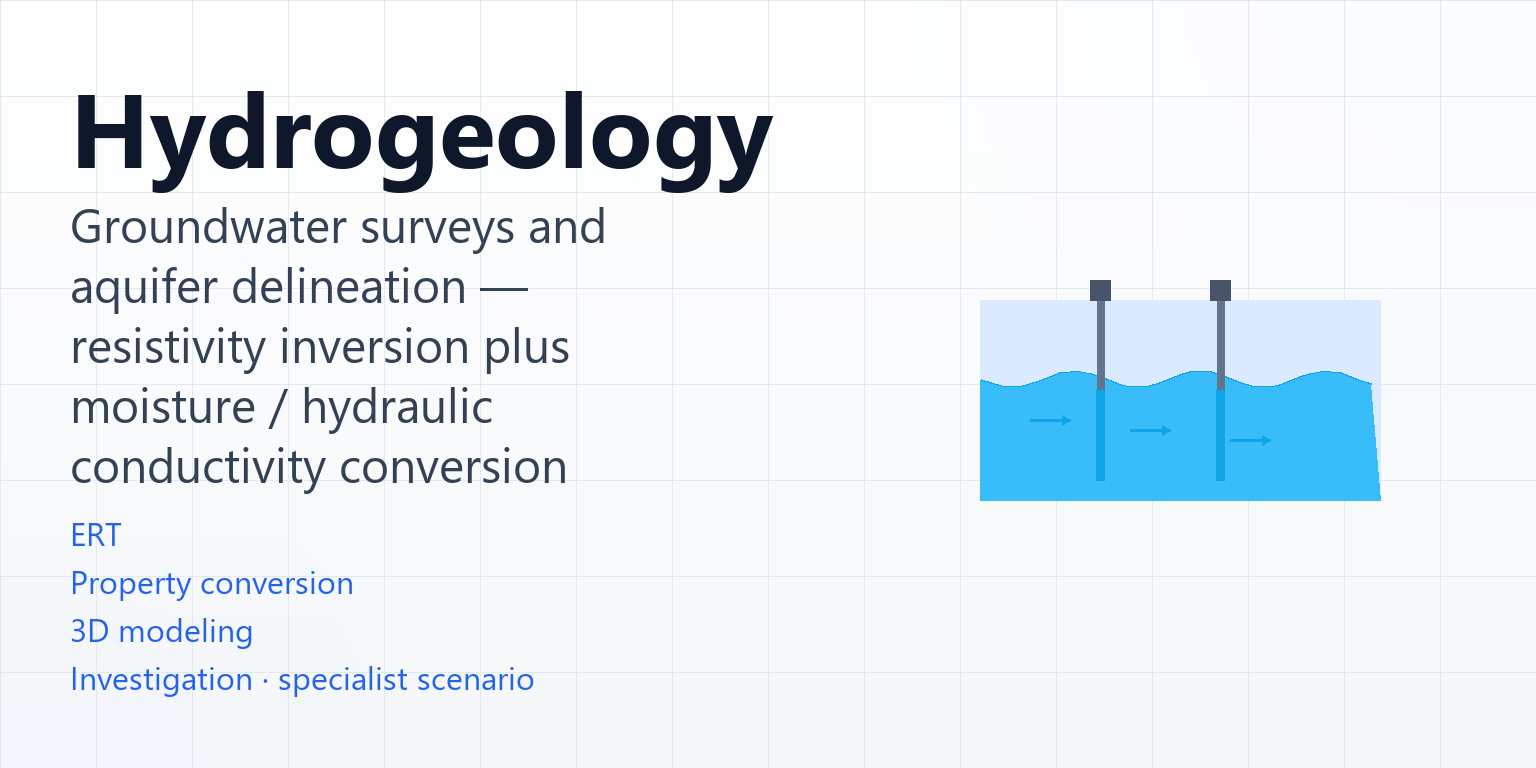
Property inversion + ground-truth calibration · resistivity-to-moisture content / hydraulic conductivity conversion Hydrogeology · aquifer delineation
ERT online monitoring plus threshold alerts
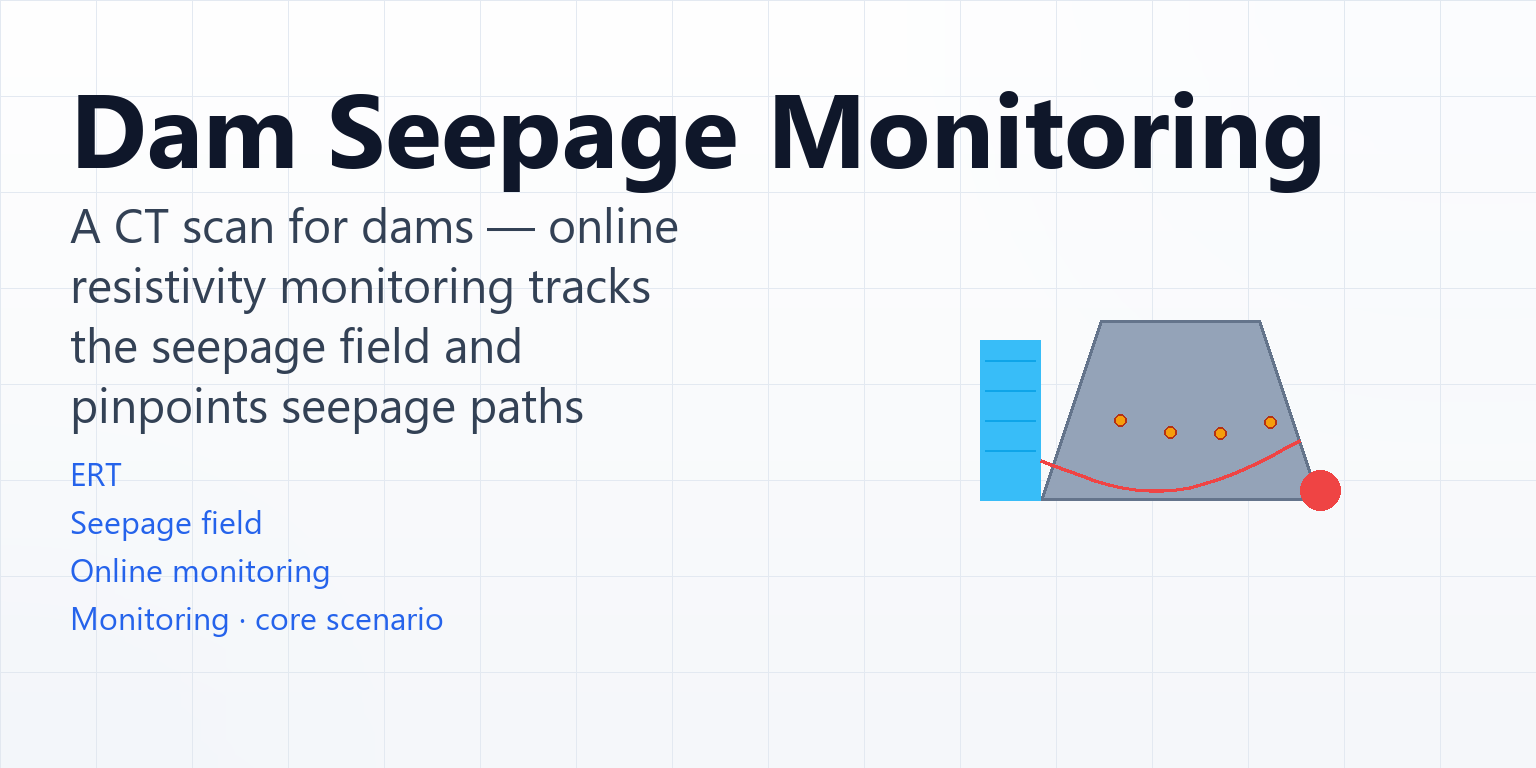
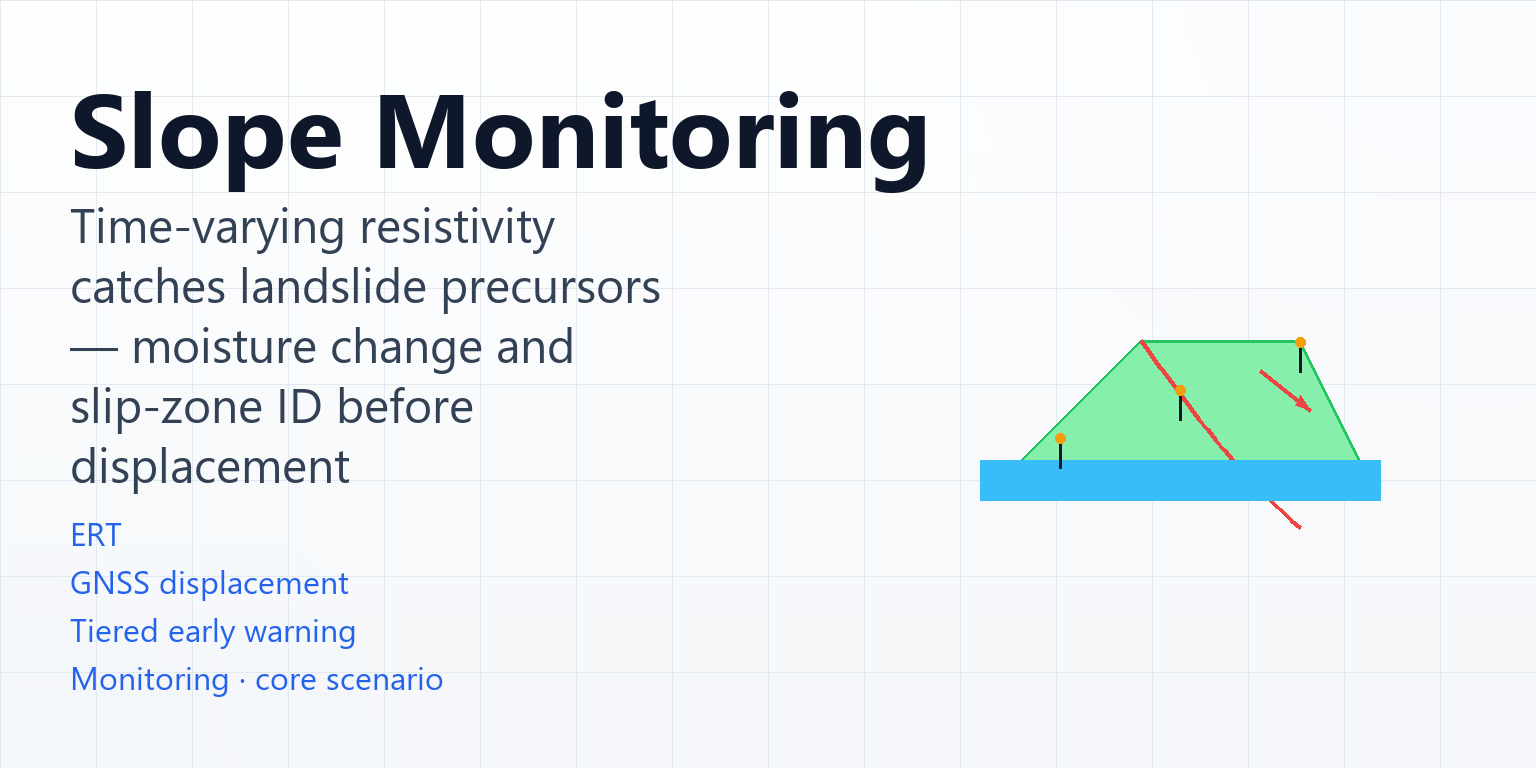
Automatic edge acquisition · automatic cloud inversion and ingestion · proactive threshold alerts Dam seepage · slope monitoring
Nine scenarios spanning investigation and monitoring
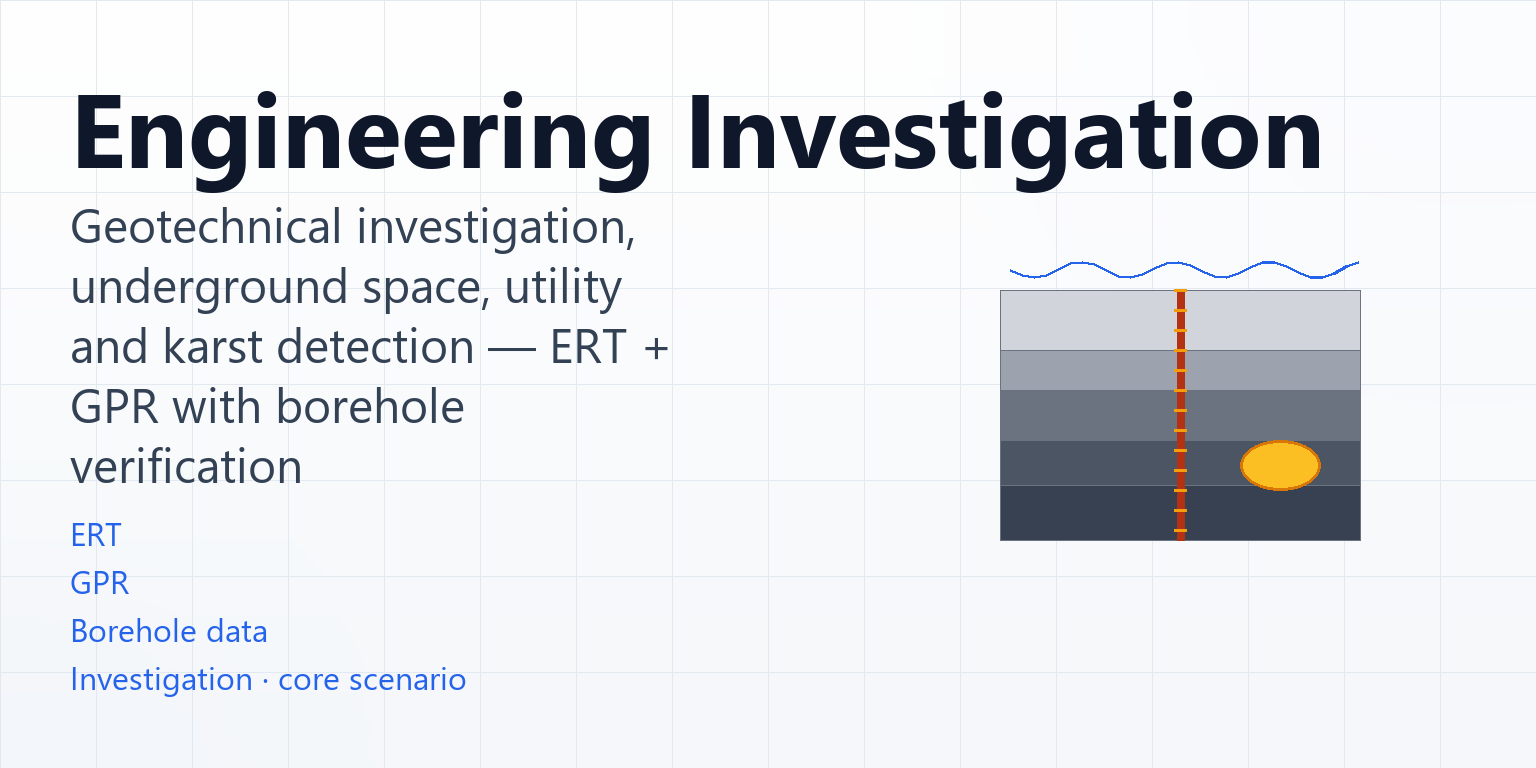
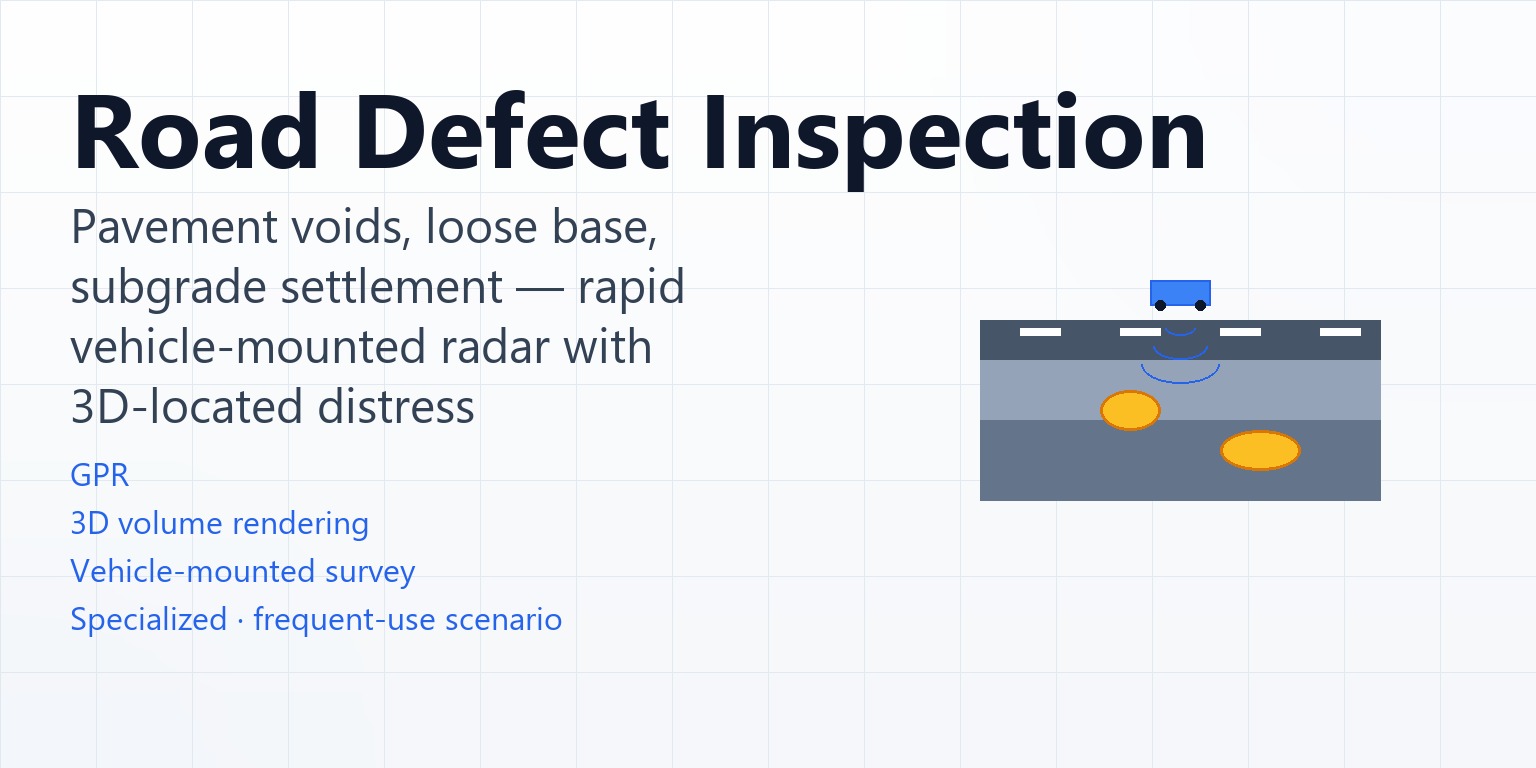
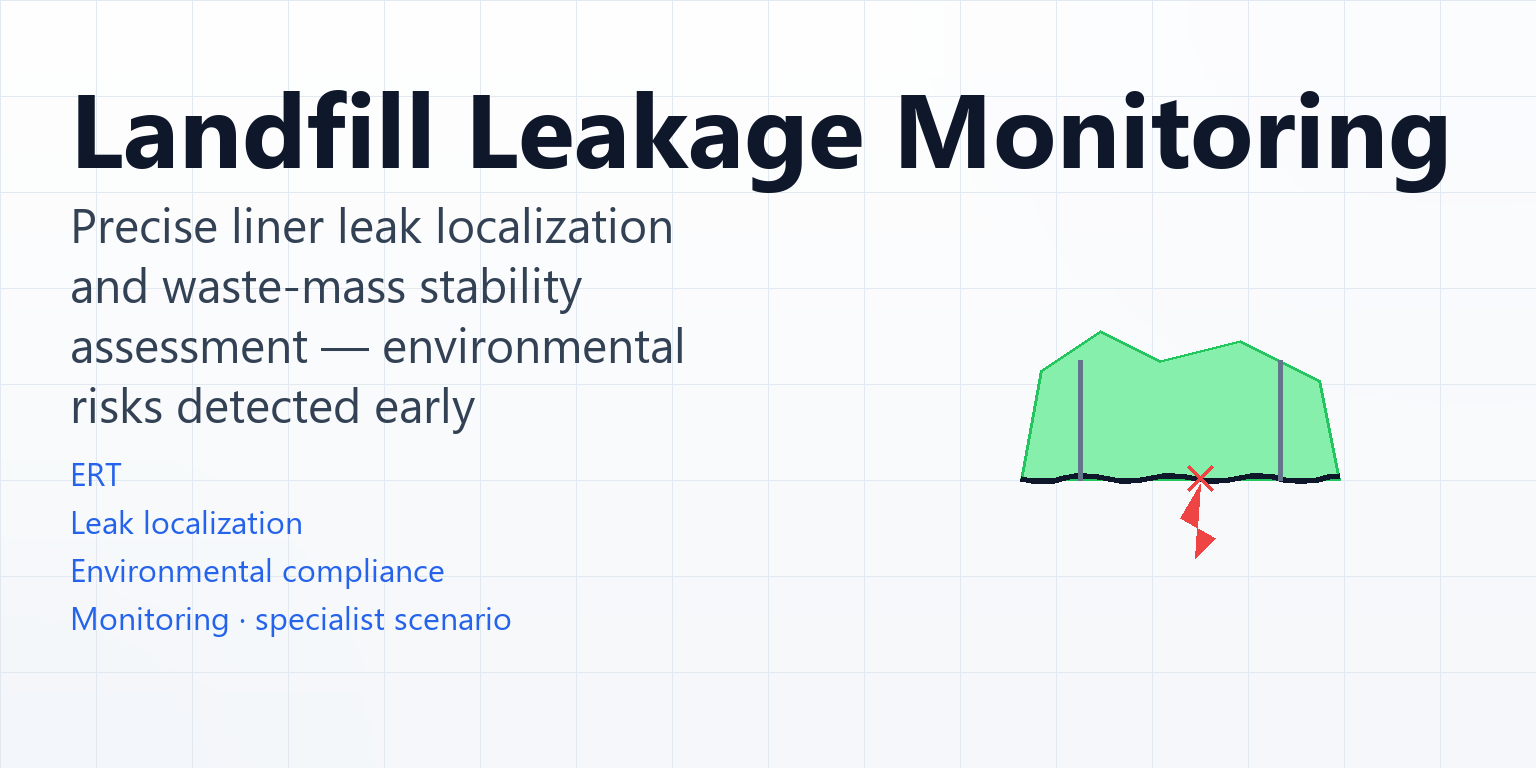
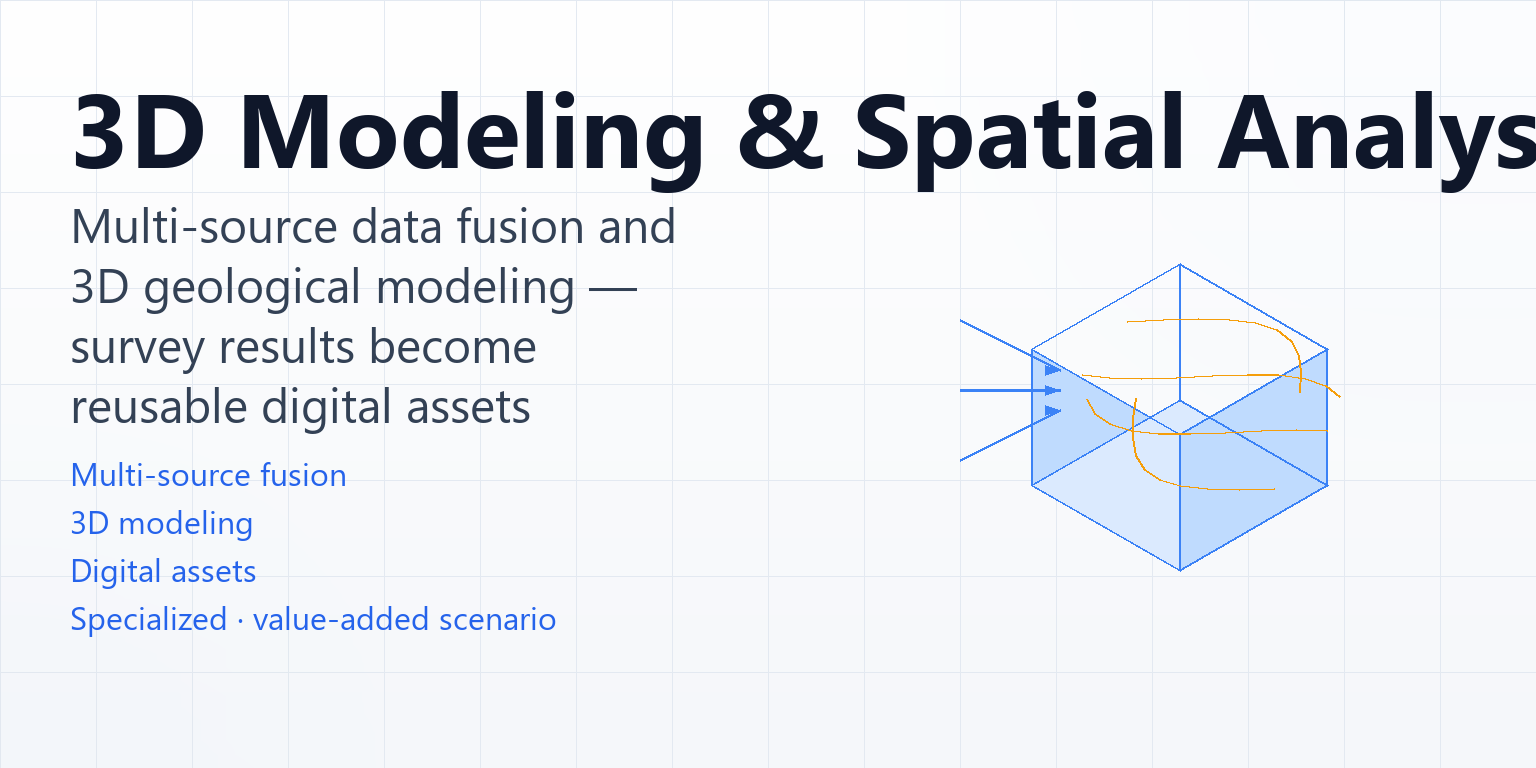
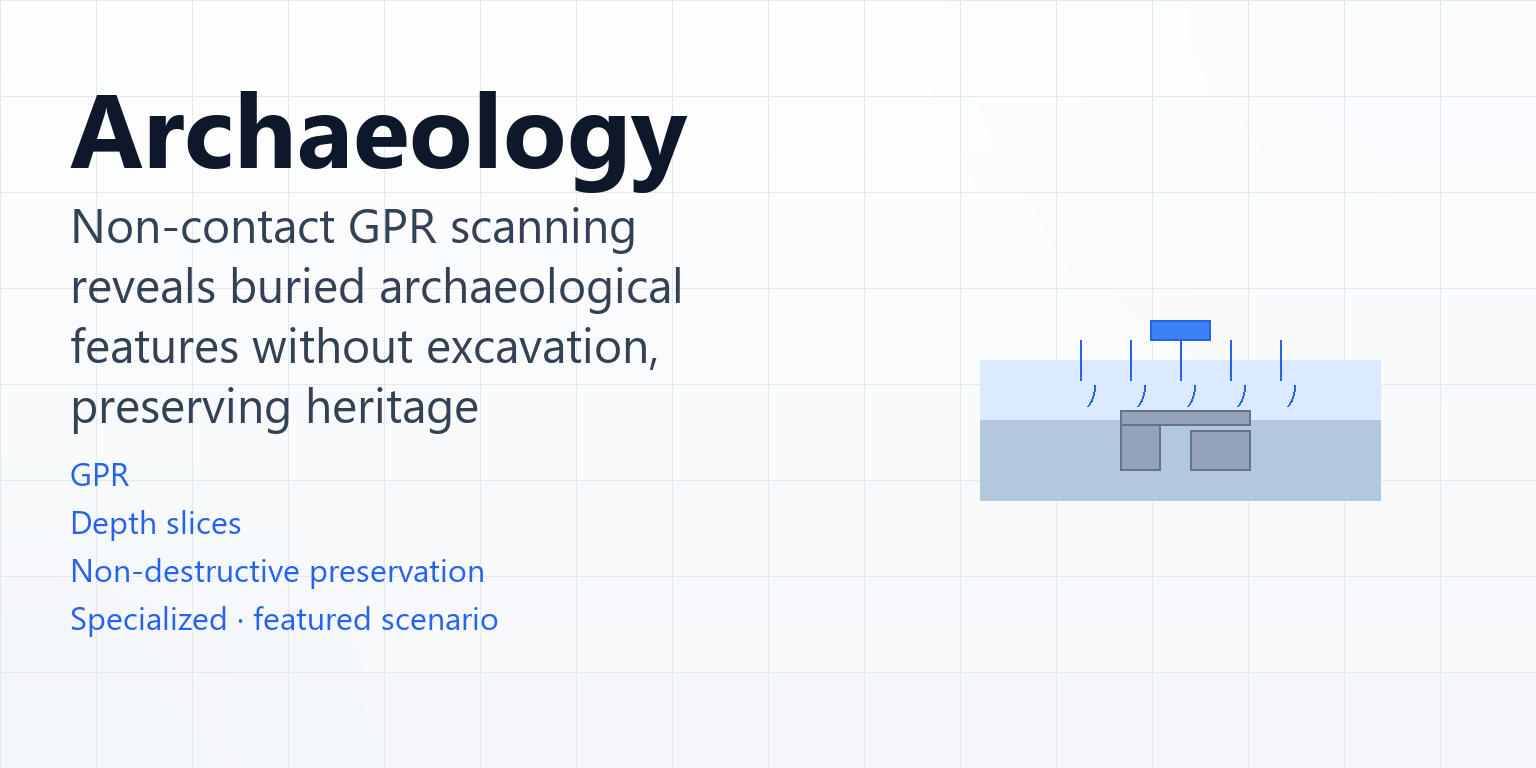
Organized along three lines — investigation, monitoring and special-purpose — each scenario covers pain points, solution architecture, method configuration, deliverables and implementation flow.
Why DIGspace
Not "a few more features" — four things that are hard to get anywhere else, all in one place.
01 Geospatial integration · multi-source fusion
Underground inversion volumes and surface remote-sensing imagery, oblique photography, terrain and vector maps share one coordinate system in one 3D scene — no multiple software packages, no repeated exports, no manual alignment.
02 Multi-method joint interpretation
ERT adds depth, GPR adds resolution, boreholes provide ground truth. Two or more physical fields cross-validate at the same location, sharply reducing the non-uniqueness of any single method.
03 Full analysis and monitoring lifecycle
One-off investigation and long-term online monitoring on one platform and one data foundation — the investigation baseline is the first period of monitoring data.
04 3D deliverables are digital assets
What you deliver is not a stack of screenshots; it is 3D results with processing parameters and lineage — recomputable, reusable, and ready to overlay against the next project period.
One architecture, coexisting across every end
Methods flourish at the top; data speaks one language at the bottom — the core platform stays stable, while capabilities grow as plugins.
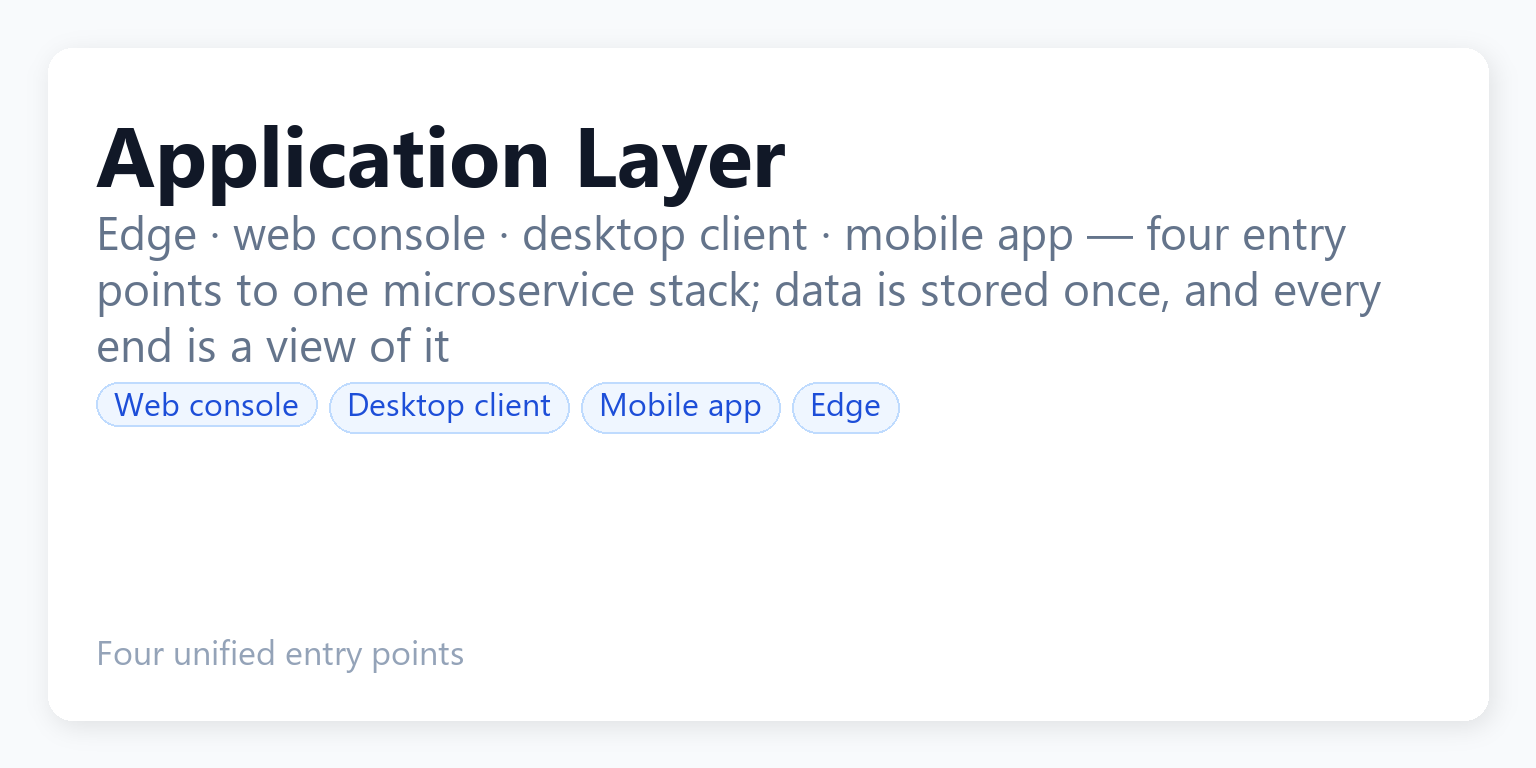
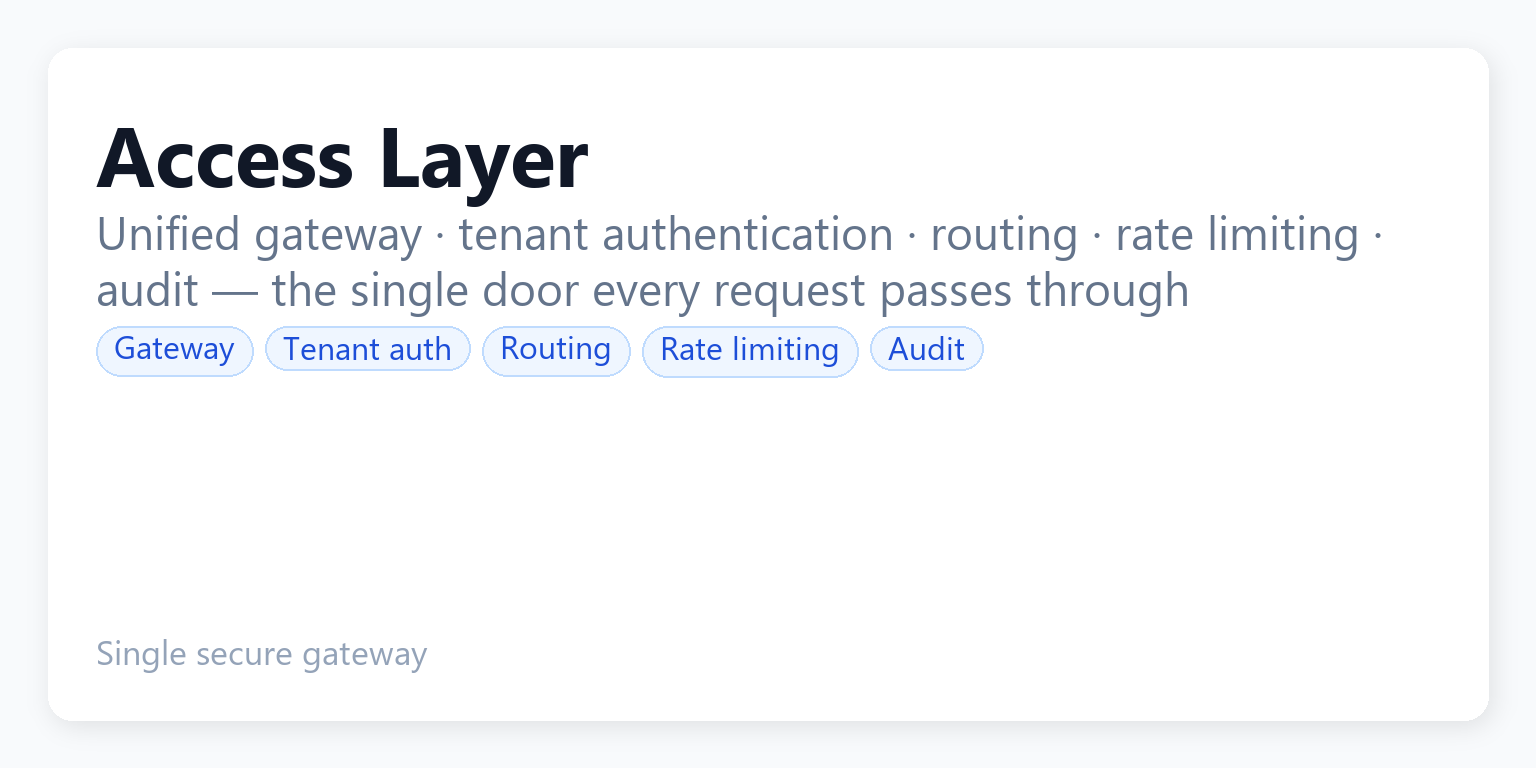
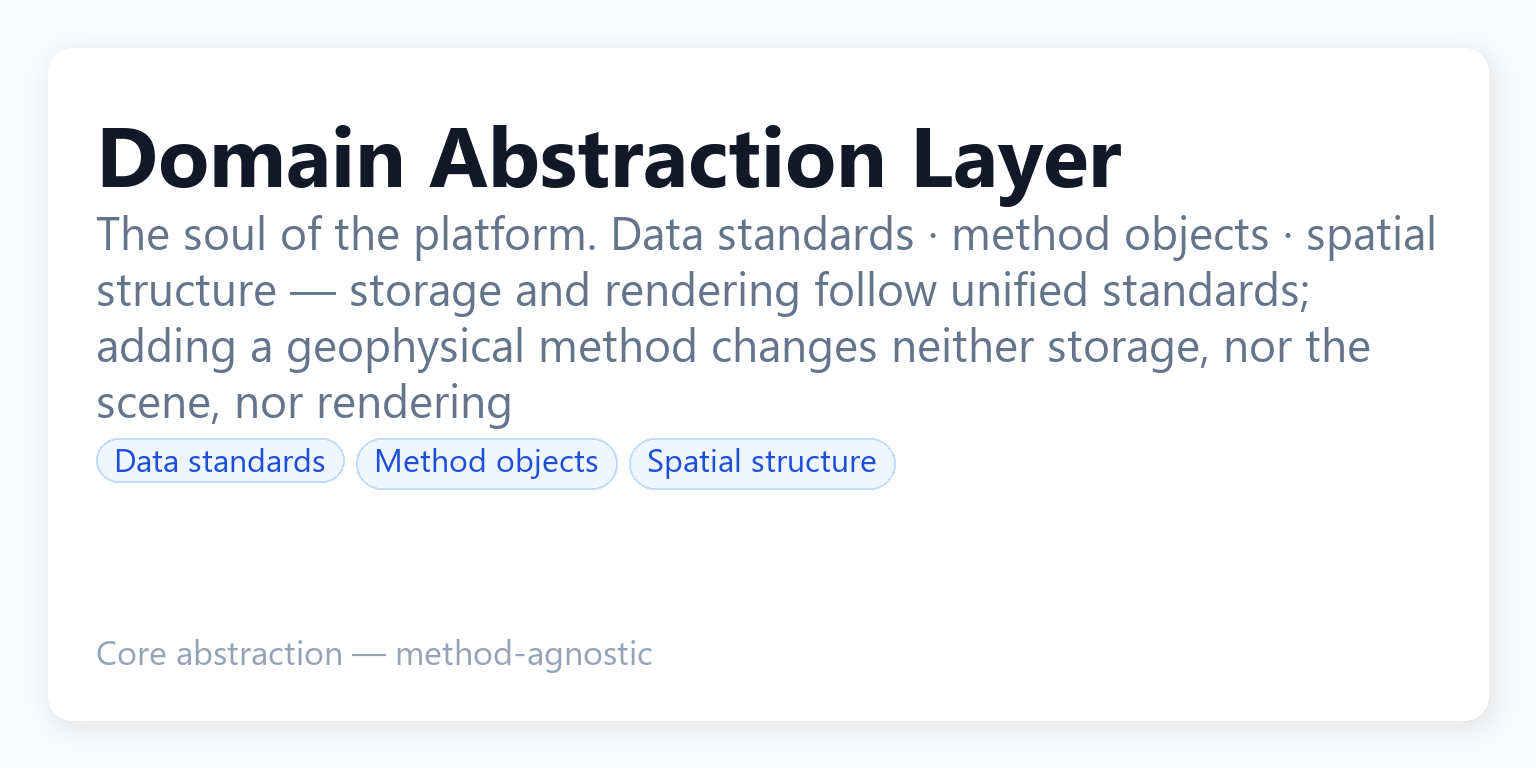
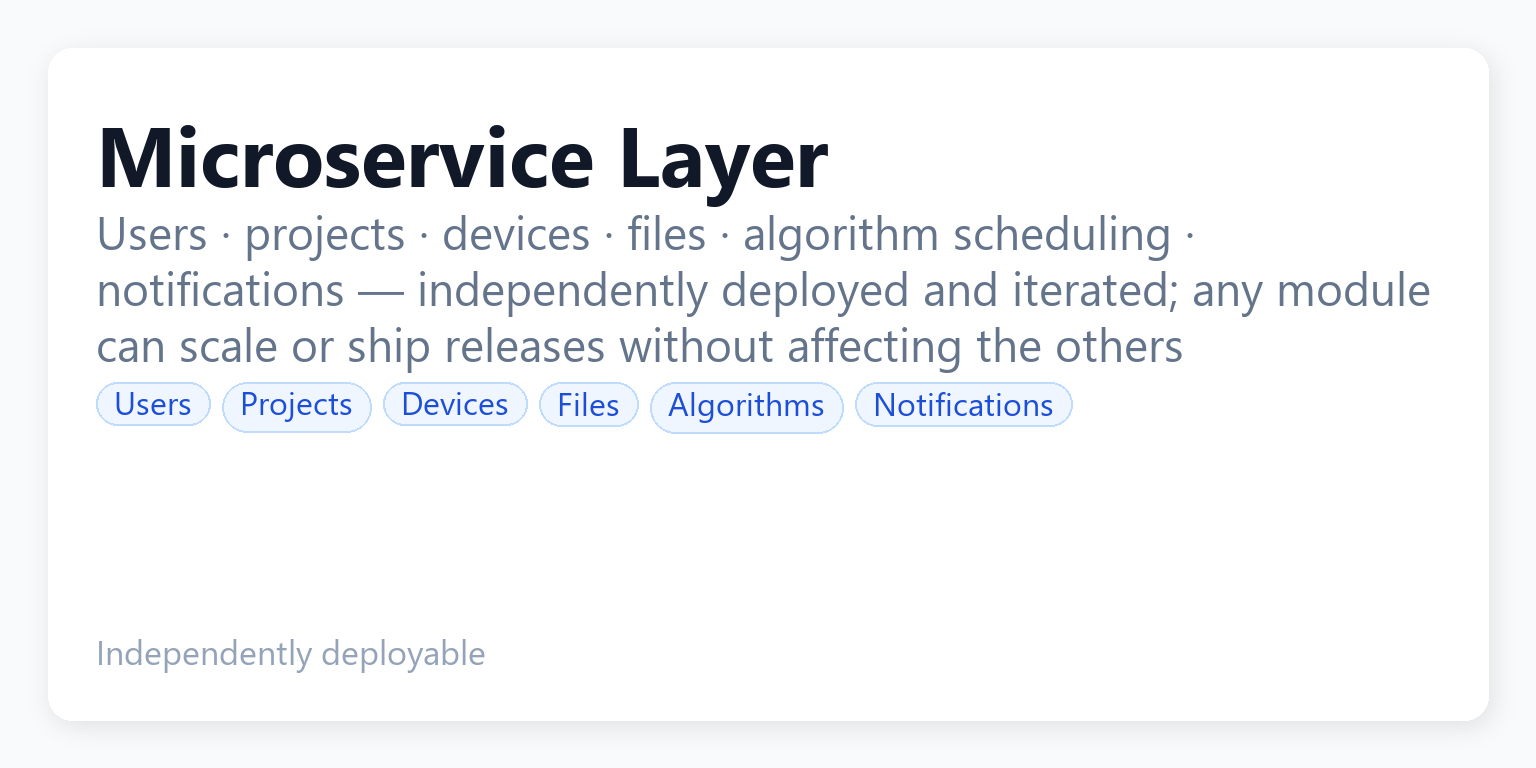
Stable core, capabilities grow as plugins
The core program does only what is core; every other capability mounts as a plugin — algorithm plugins are added by configuration, with no core changes, no releases, no disruption.
🧩Algorithm plugins · added by configuration
ERT inversion, data filtering, moisture-content conversion and blanking, along with GPR zero-time removal, gain recovery, band-pass filtering and background removal, are all mounted as plugins — a new algorithm can be added by configuration, with no core changes.
🔌Business extension plugins · growing with their own pages
Customer and partner tools — monitoring dashboards, custom workflows — grow on the platform: business plugins can bring their own pages without touching the platform core.
Public plus private cloud, one tenant system
Low-latency access in China and overseas with clear data boundaries and seamless collaboration — three deployment models, one architecture, one experience.
Full public cloud
Small projects · fast go-live Out of the box, no deployment needed Field app acquisition syncs to the cloud automatically Elastic compute, cloud inversion Multi-user collaborative online viewing Dual data centers in China and overseas
Hybrid model
Primary model Classified data stays on private cloud · collaboration runs on public cloud Classified raw data never leaves the intranet Collaboration and viewing run on public cloud Secure on-demand data synchronization Project / data-set level permission control
Full private cloud
Key projects · fully intranet Runs fully on intranet, physically isolated Raw data and documents retained permanently High-performance computing, batch processing Suited to provincial institutes and key projects
Get started with DIGspace
Register an account to start importing and visually analyzing data: in-depth interpretation on desktop, online collaboration on the web, and field re-survey on mobile — one account, one data set.