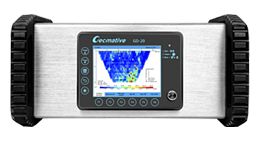

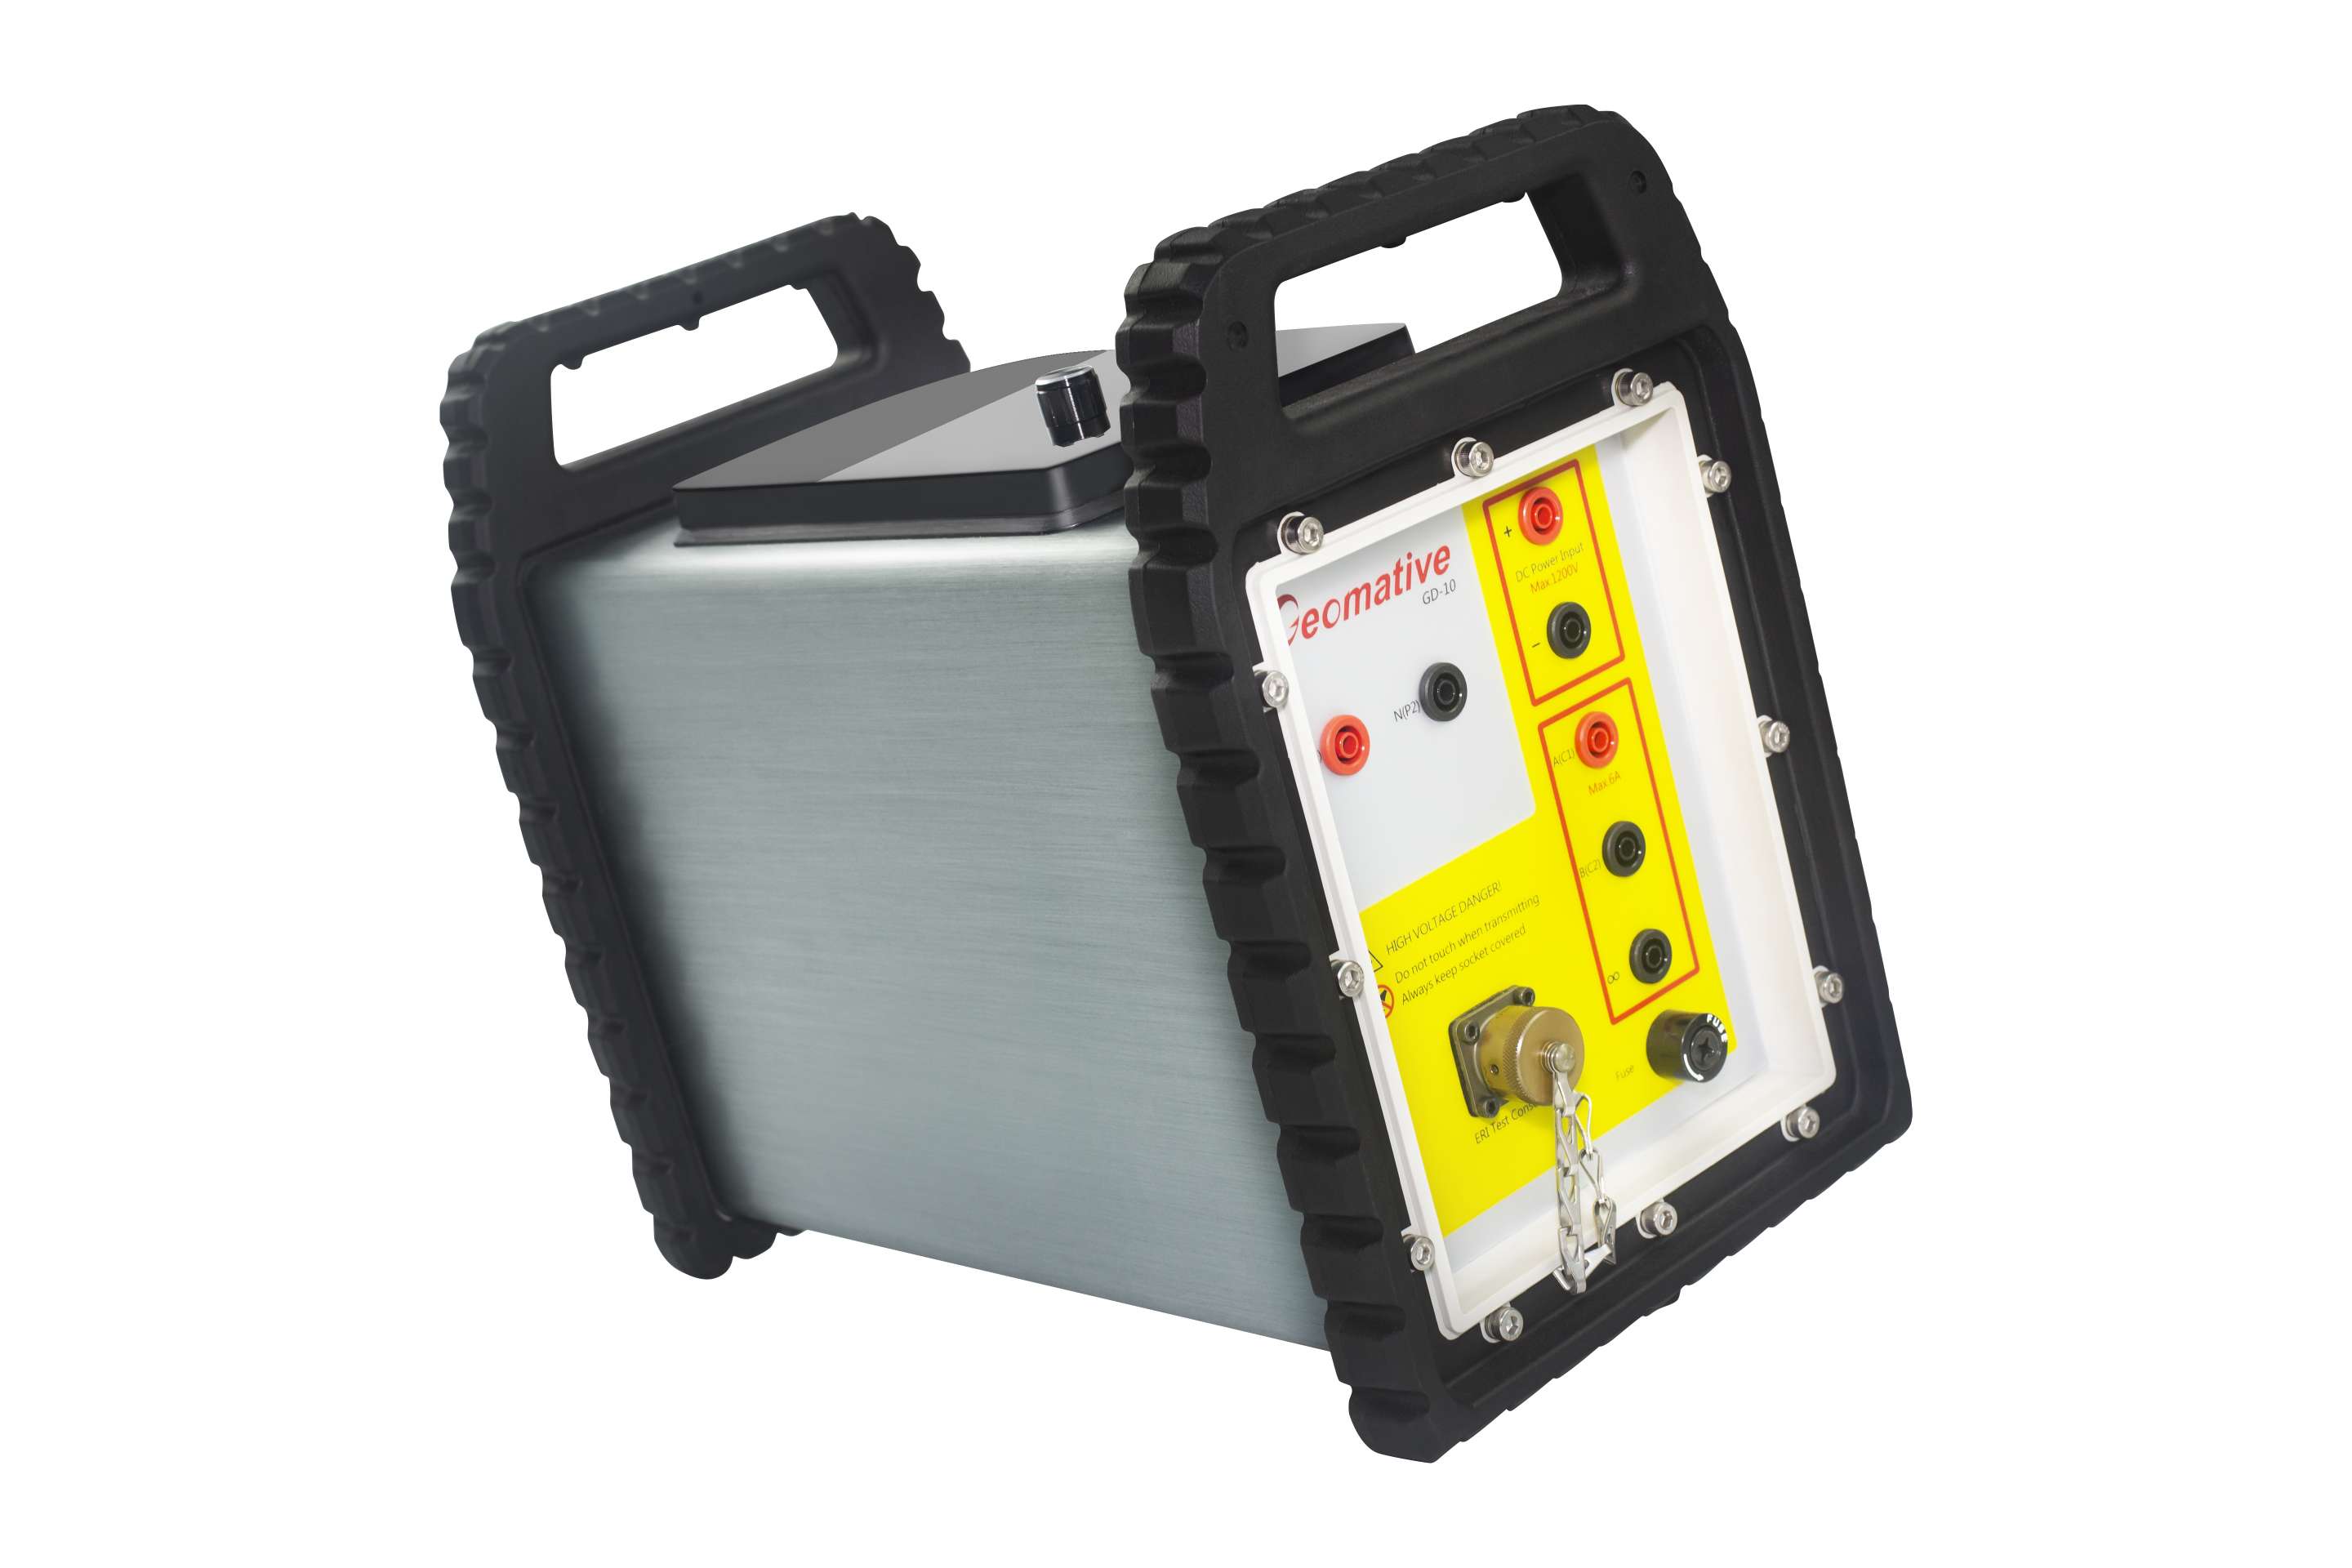
The methodology of the study consists of materials collection; literature collection and review, geological observation and geophysical (VES) survey, data computation, processing and interpretation; and finally report preparation. The Vertical Electrical Soundings (VES) using Schlumberger Array was conducted with Geomative GD-10. Other accessories that were used during the study were District Map, GPS (Global Positioning System), Photographic Camera, Brunton Compass etc. Literatures and information related to topography, climate, geological condition of the area was collected and reviewed. Resistivity Meter (Geomative GD-10) is used for vertical electrical resistivity sounding (VES) data collection. GPS is used to take spot location of the observation point (VES- Point) and other important features like dug wells, tube wells water body etc. Photograph were taken to characterize the topographical and morphological character of the area. The general geology, hydrogeology of the area is taken from the geological map, hydrogeological map of the area prepared by Department of Mines and Geology. The description of the geology of the area is done from the published and unpublished literatures and verified in the field by observation and field measurement.

Figure 3 Schematic Diagram of Vertical Geoelectrical Sounding Data Acquisition
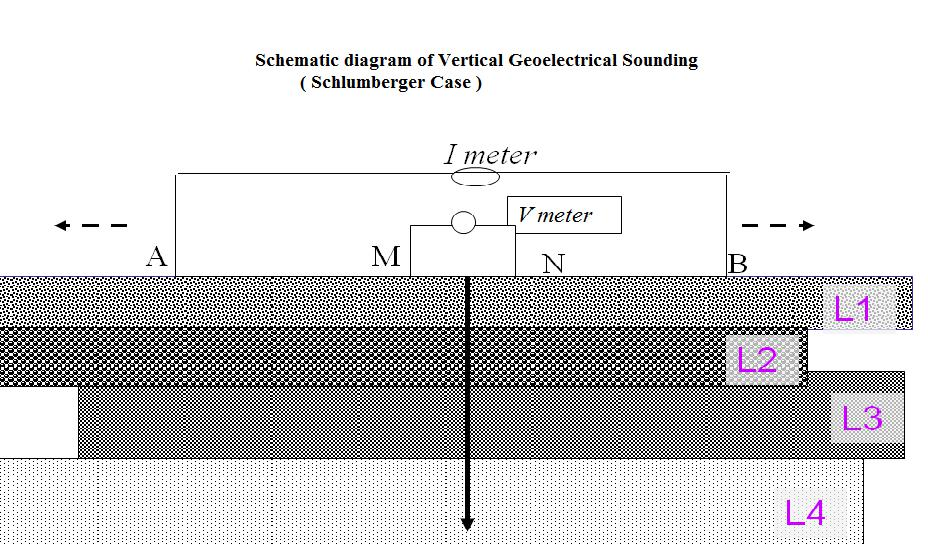
In the present case, in the ward no. 3 of Devchuli Municipality Vertical Electrical Soundings was performed to cover the area using Schlumberger array of electrode configuration. The survey point and VES profile is shown in Figure 4. In VES survey, the current electrodes were taken up to 300 meter distance on both sides of the sounding site, increasing the distance of current and potential electrodes after each successive observation. Thus, increasing the distance of the current and potential electrodes enables to obtain information from deeper part of the underground layers

Figure 4 Google Map Showing Survey Area and Profile Lines
Geo-electrical sounding is widely used geophysical method for groundwater exploration, environmental application and other engineering application. The benefit of this method is to perform the survey quite fast and in the cost-effective manner. Detection of water table, variation of resistivity with depths (distinguishing layered earth), contaminants plume detection etc. are the objectives of VES survey. The interpretation of electrical resistivity sounding data is the process of deriving the values of true resistivity (ρ) and thickness (t) of various subsurface strata from the values of recorded resistance (R) or apparent resistivity (ρa) at electrode separations (a). There are a number of interpretation techniques for evaluating (ρ) and (t) of each of the stratum as proposed by many investigators. These can be grouped as analytical, numerical, empirical, graphical, computer (software) based etc. and several amongst each category. In the present case Vertical Geoelectrical Sounding was made to cover the area using Schlumberger array of electrode configuration. The survey point is shown in Figure 4. Topographically, this area consists of flat land. In qualitative interpretation, general conclusive remarks regarding to lithological variation are made in terms of apparent resistivity values. The data acquisition, data filtering and interpretation was carried using standard norms by Geophysicist and Hydrogeologist. The apparent resistivity values ρa were plotted against the electrode spacing (AB/2) on a log-log scale to obtain the VES sounding curves using the computer software IPI2WIN software which is developed for the purpose of data processing, analysis and interpretation. The field curves together with the best fit model curve of sounding site is drawn in double log-log sheet, photographs of the survey are presented in the Annex. The resistivity values shall be interpreted in terms of lithology and thickness in quantitative analysis. The resistivity of certain layer depends up on rock type, grain size, degree of void spaces and amount of water present, degree of weathering etc. Based on different studies carried out in different part of Nepal, the general correlation table is shown in Table 1.
Table 1 Correlation of Resistivity and Lithology

Table 2 Expected Lithology of the Survey Area from VES

It is revealed from above discussion that there is presence of open aquifer in the survey site. Groundwater extraction from this aquifer is possible but variation in water level might occur. Presence of fine, medium and coarse sand, pebbles and granules size particles indicate the water bearing strata in the survey areas. It is recommended to drill the well for the purpose of the irrigation. Drilling up to the depth of 110 m is recommended in this location.


Figure 5 Model curve of VES from field data

Figure 6 Data Acquisition in field.

Figure 7 Data Acquisition in Field

Industry-leading geophysical equipment and service provider supplier